Scaler
Project briefing
How might we evolve our survey tool into an integrated data request system within the input portal, where consultants can request and collect ESG data directly in the asset overview, and property managers have controlled editing rights supported by approval workflows?

Methods
- UX Research
- Customer interviews
- Design Workshops
- Prototyping
- Usability testing
Tools
- Figma
- Miro
- PostHog
- Chat GPT
Scope
In scope
- Integration: embedding the data request tool into the input portal to avoid duplicate workflows.
- Simplification: Provide simplified versions of the pages for easier fill out process for property managers.
- Requesting: consultants can directly ask for ESG data.
- Collecting & Editing: property managers provide data, with controlled editing rights.
- Governance: approval workflows ensure quality control.
Out of scope
- Full back-end implementation of permissions model (handled in parallel)
- Automated reporting integration
Research sources
Quantitative research
We used PostHog to analyze usage patterns, completion rates, and drop-off points across active surveys to identify friction areas and dead ends.
Qualitative research
Interviews with consultants and property managers confirmed frustration with duplicate entry across surveys and portal.
Feedback highlighted the need for direct edit access with safeguards, not just one way survey submissions.
Quantitative results
Surveys felt disconnected
Users wanted a unified workflow inside the input portal, not a separate tool.
Controlled collaboration is essential
Consultants need external users to contribute data, but without losing control or data integrity.
Approval reduces risk
Property managers were more willing to engage if they could edit directly, while consultants needed confidence that nothing bypassed their review.
Qualitative results
Consultants aren’t using the survey tool, they’re still using Excel.
Because of poor usability and limited flexibility, consultants fall back on sending Excel sheets to collect data. This creates a lot of manual back and forth, increases risk of human error, and adds overhead to track what’s missing, reviewed, or needs clarification.
Property managers struggle to understand what’s expected of them.
Surveys are often too complex, unclear, or overwhelming. Respondents don’t know what data is required vs. optional, don’t have contextual help, and aren’t given guidance on what each field means or how to fill it in. This leads to a lot of drop off.
Edits, empty fields and versioning aren’t handled well.
Once data is submitted, it’s hard to edit or review fields. Consultants want the ability to distinguish between editing current data vs. creating new versions, with full transparency on what’s been changed. Currently the whole process is very error prone.
Core issues identified
The scope and research combined we can define the following focus points for the redesign.
Clients are managing many assets per PM
Navigating between assets for a specific survey is time consuming as they need to return to the overview to do so. This is leading to recipients failing to complete all surveys.
Senders need the ability to send historic data
Users only had the ability to add new data, not edit any historical values. This essentially makes the tool useless as users cannot correct data when needed.
Handling empty fields and marking them with reasons
No way for the users to send back empty fields if they do not know certain data, or to leave comments per field if they do not know the answer.
Survey creator adding individual meters
The survey creators have no way to select individual meters, leading to a lack of knowledge of what they are actually sending to the recipients.
Additional painpoints from interviews
- “Surveys are not usable, they don’t know what they are looking for.”
- “We still rely on Excel templates and example files.”
- “Layout needs a full overhaul, it’s too clunky.”
- “Survey forms aren’t mobile-friendly.”
- “They need to differentiate between current version vs. new version edits.”
- “No clear guidance on which surveys to fill out when.”
- “Requesting fields per asset is still too manual.”
Focus points
Integrated data requests
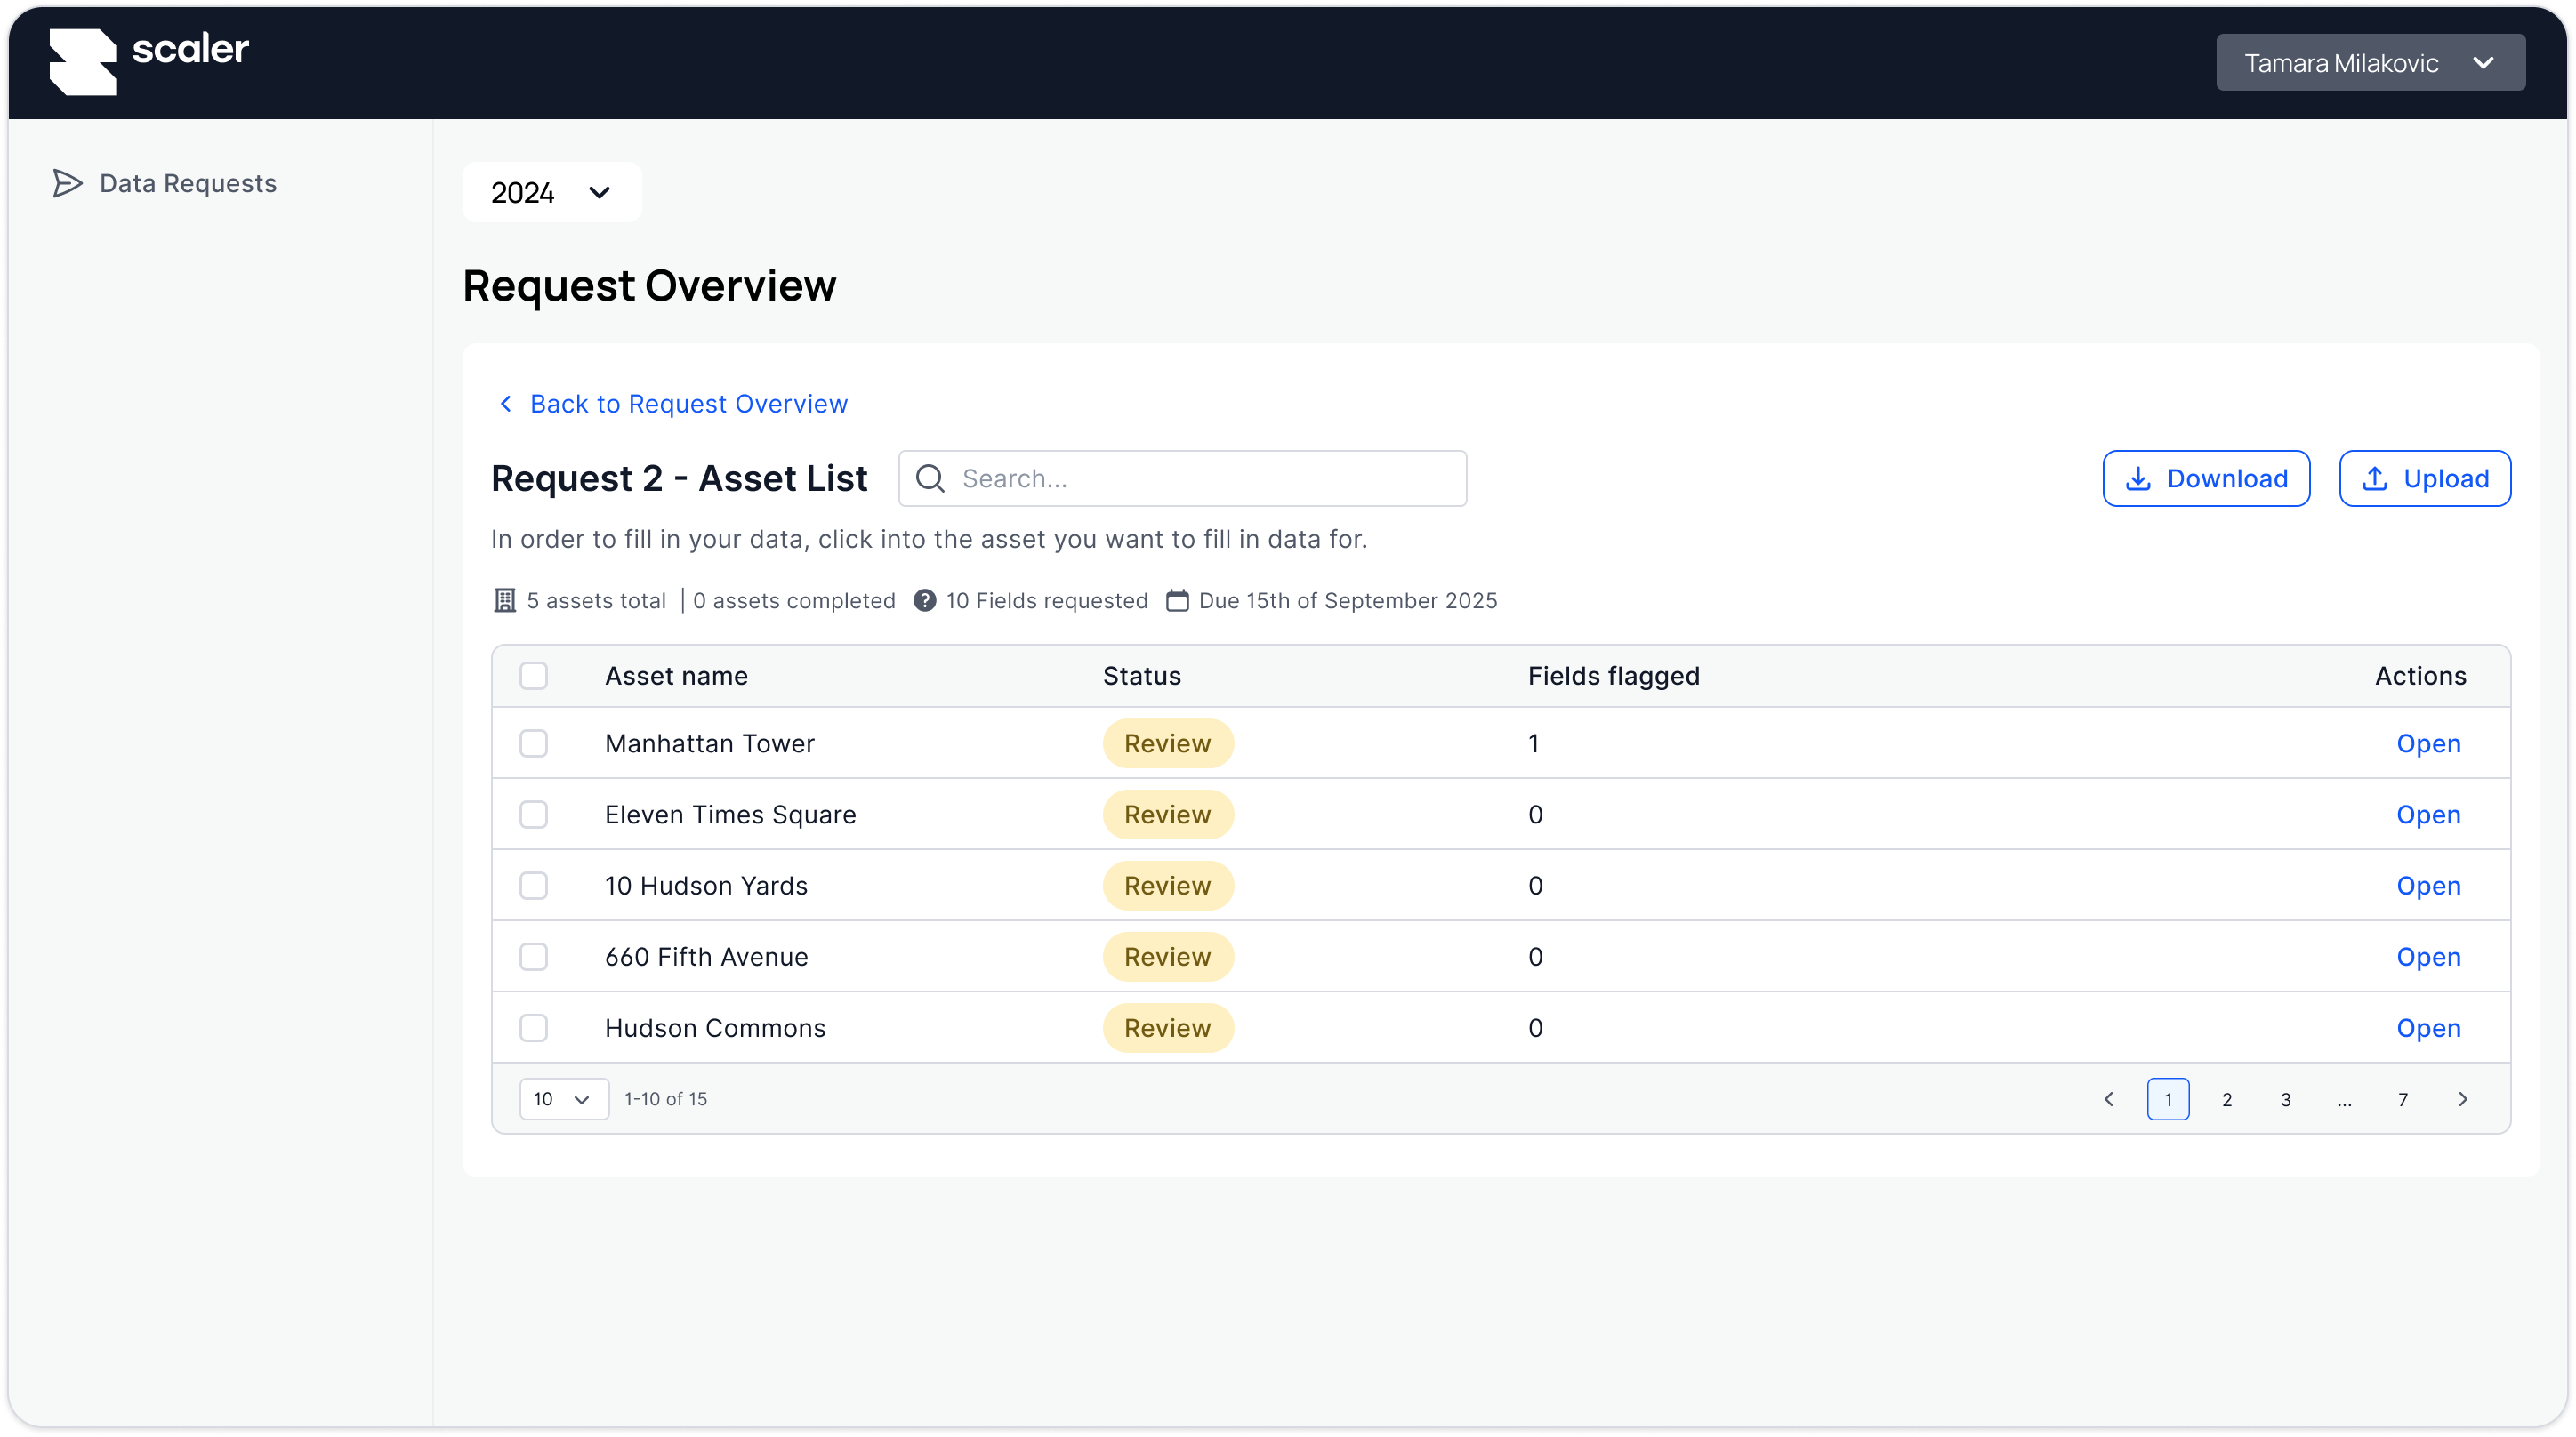
Create data requests directly from the asset overview, targeting specific fields or meters.
Controlled editing
New contributor role allows external users to enter or update data, but edits remain pending until consultant approve.
Approval workflow
Consultants review and approve edits, with clear visibility into what changed and who made the update.
Transparency & collaboration
Commenting, outlier detection, and field-level tracking built into the portal for more efficient reviews.
Concept definition & prototype
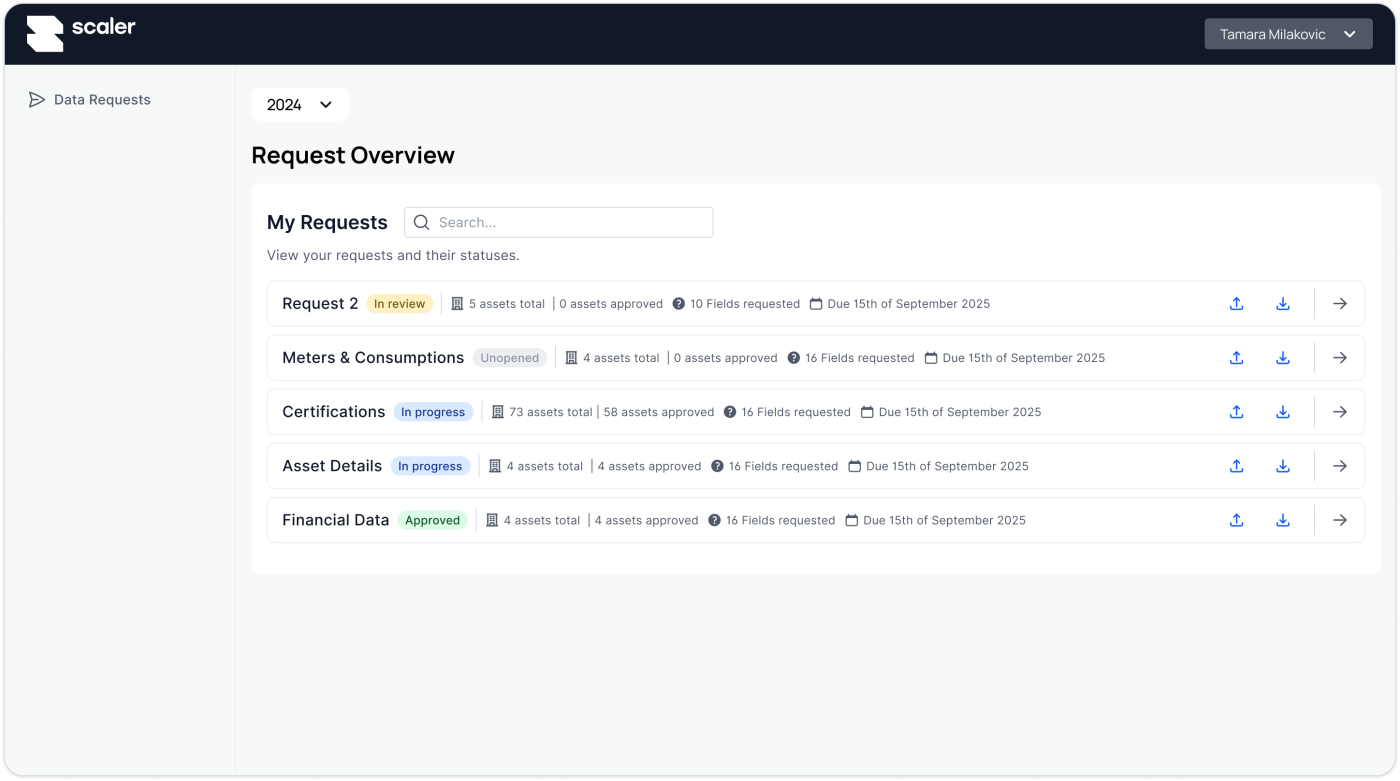
We designed a new data request panel inside the input portal, with the following flow:
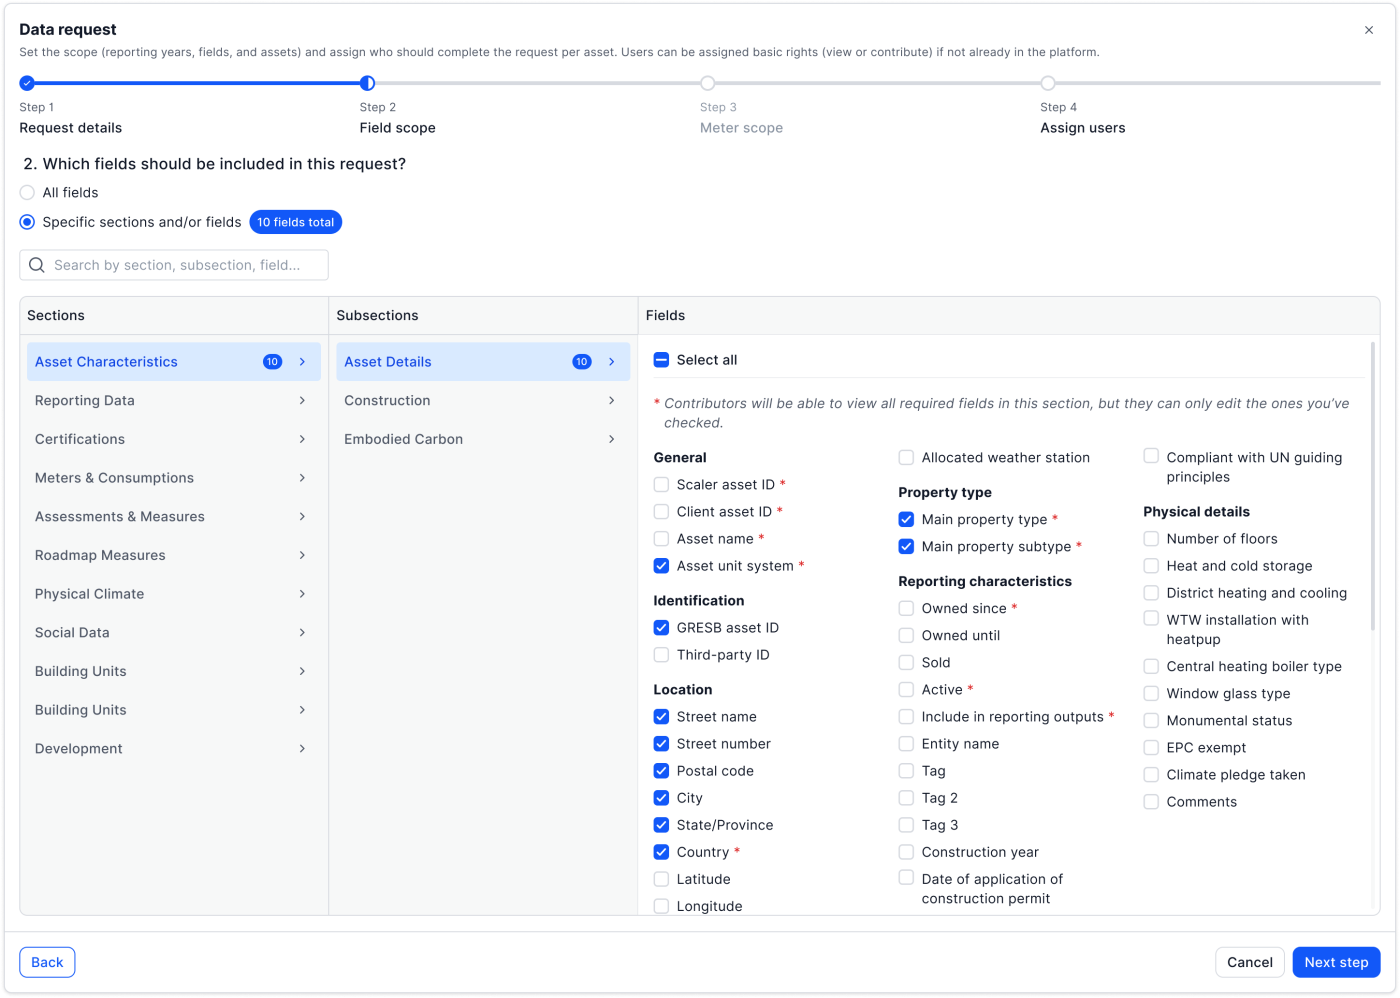
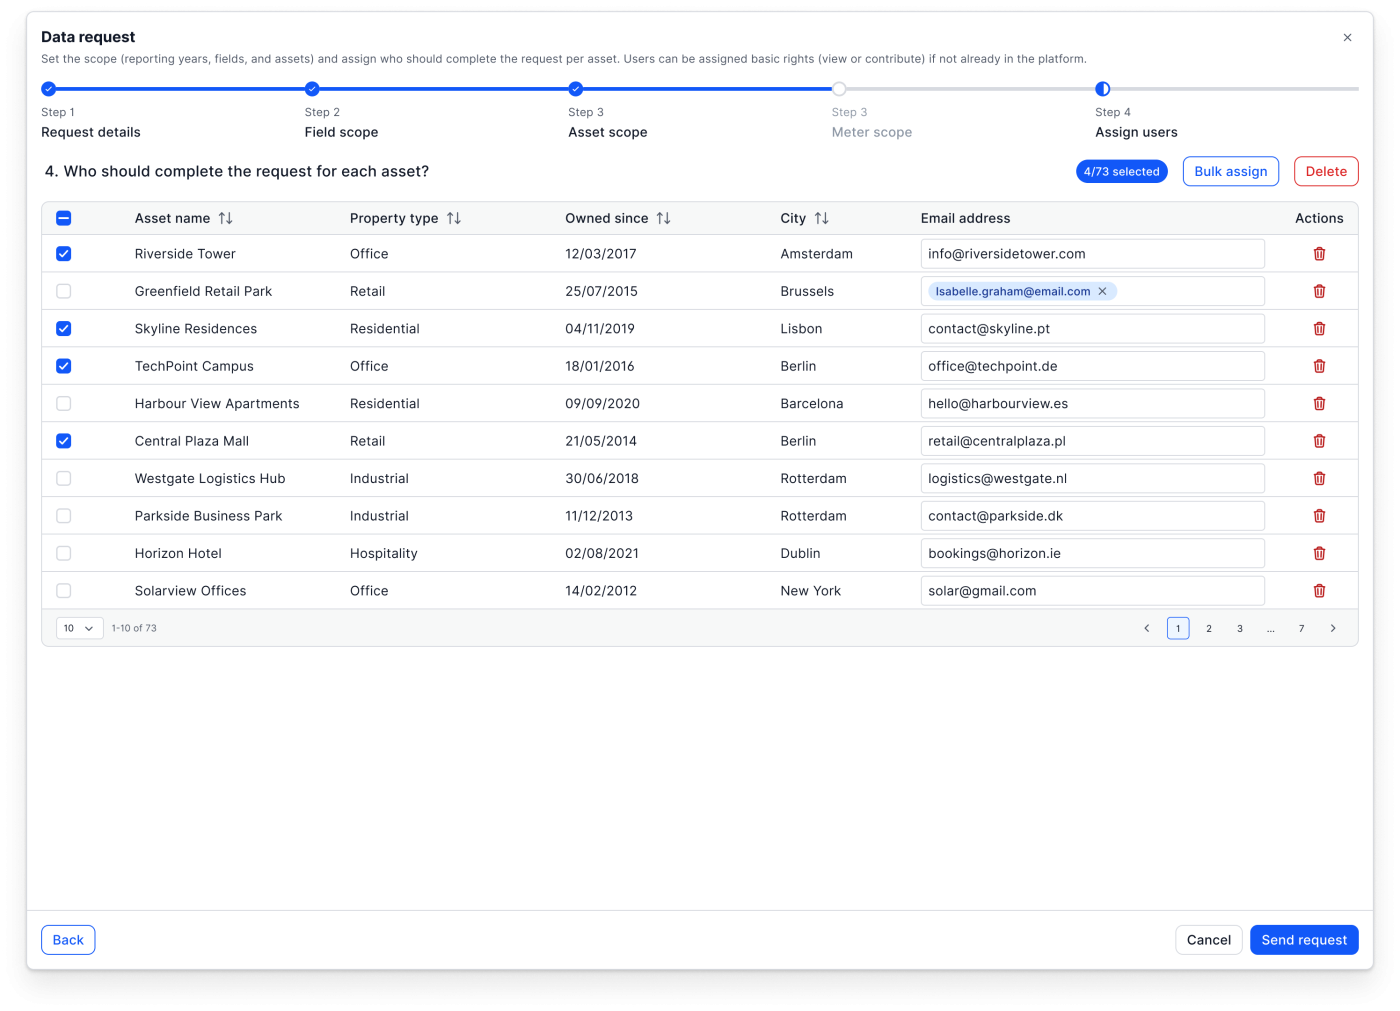
Requesting data
Consultant selects fields/meters directly from asset overview → assigns to external collaborator → request logged in system.
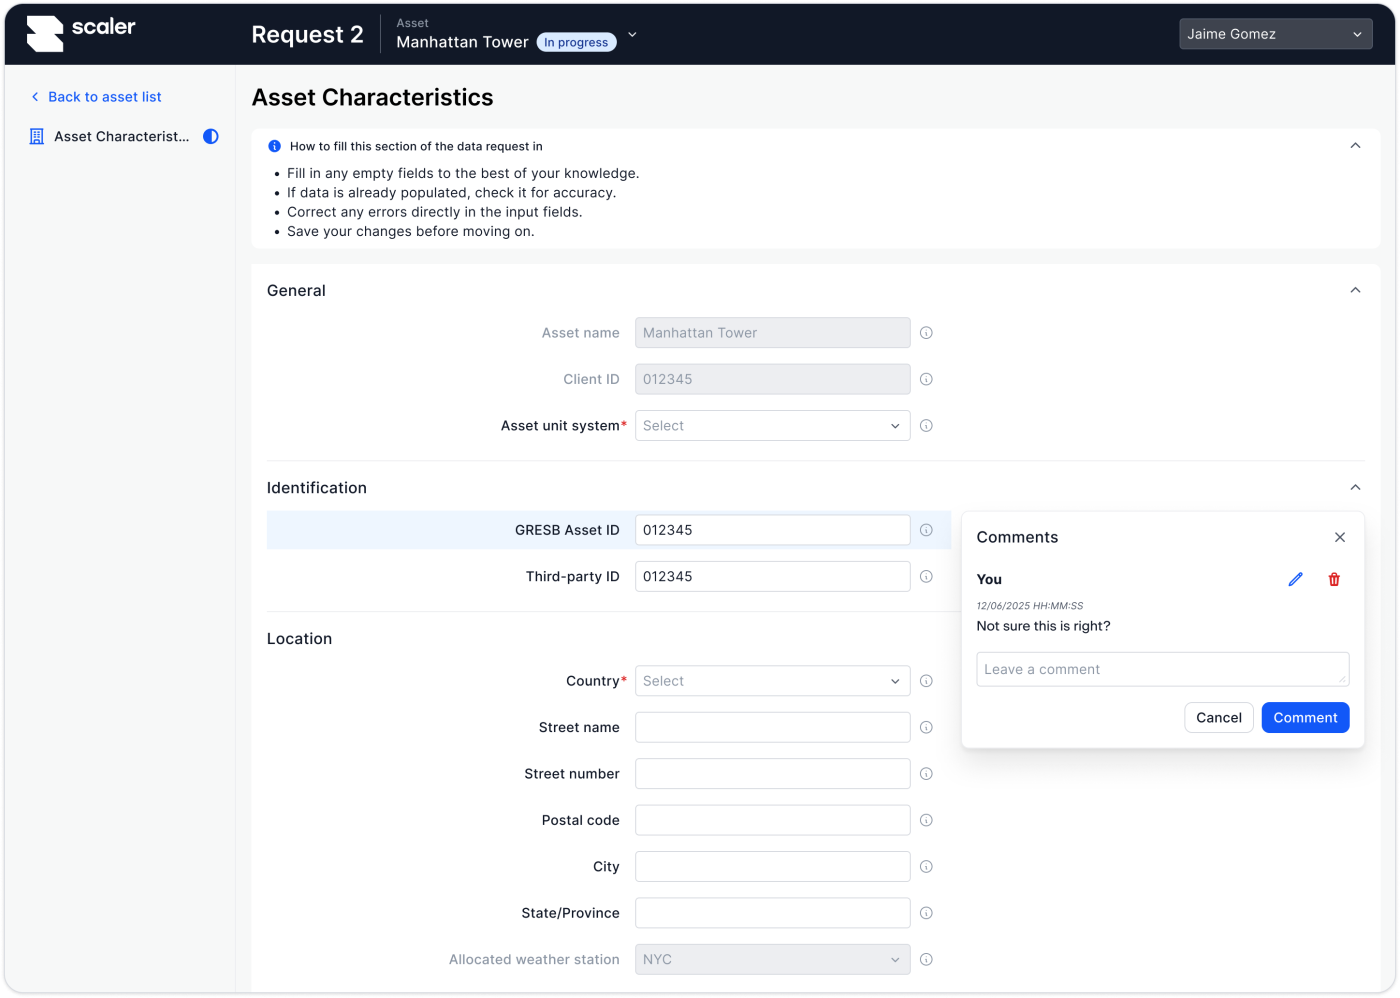
Editing data
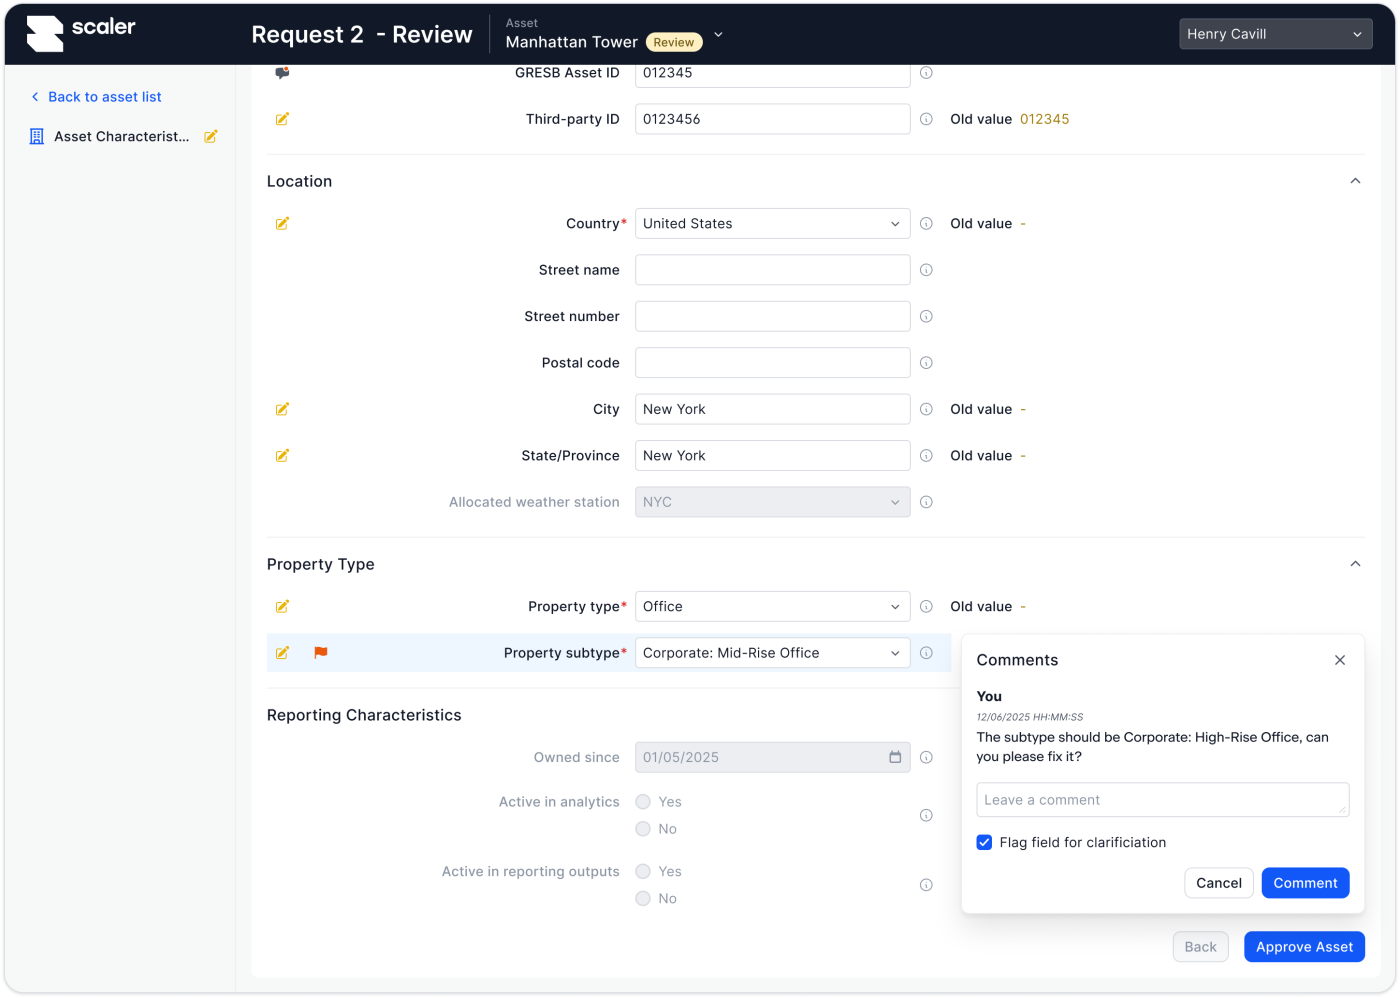
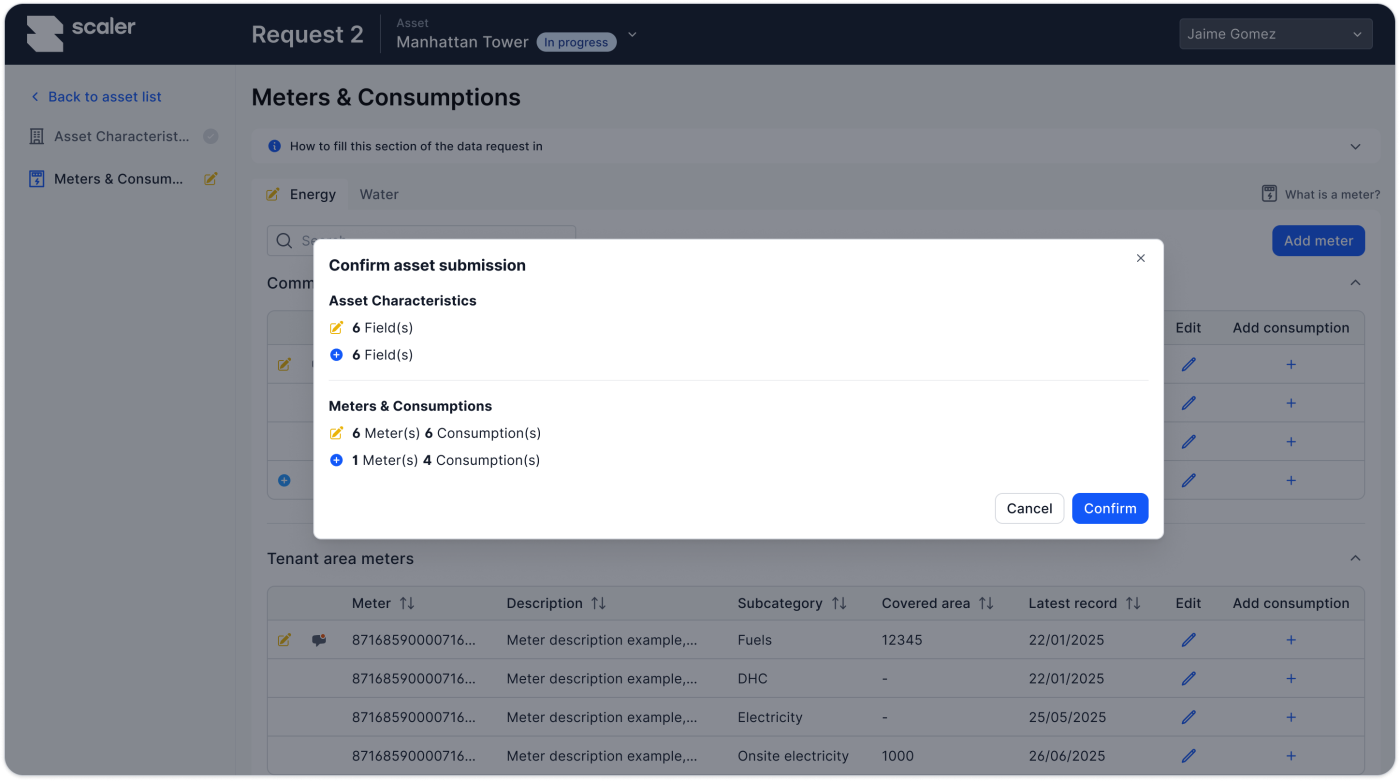
Collaborator sees requests in portal → edits fields inline with contextual guidance → submits for approval.
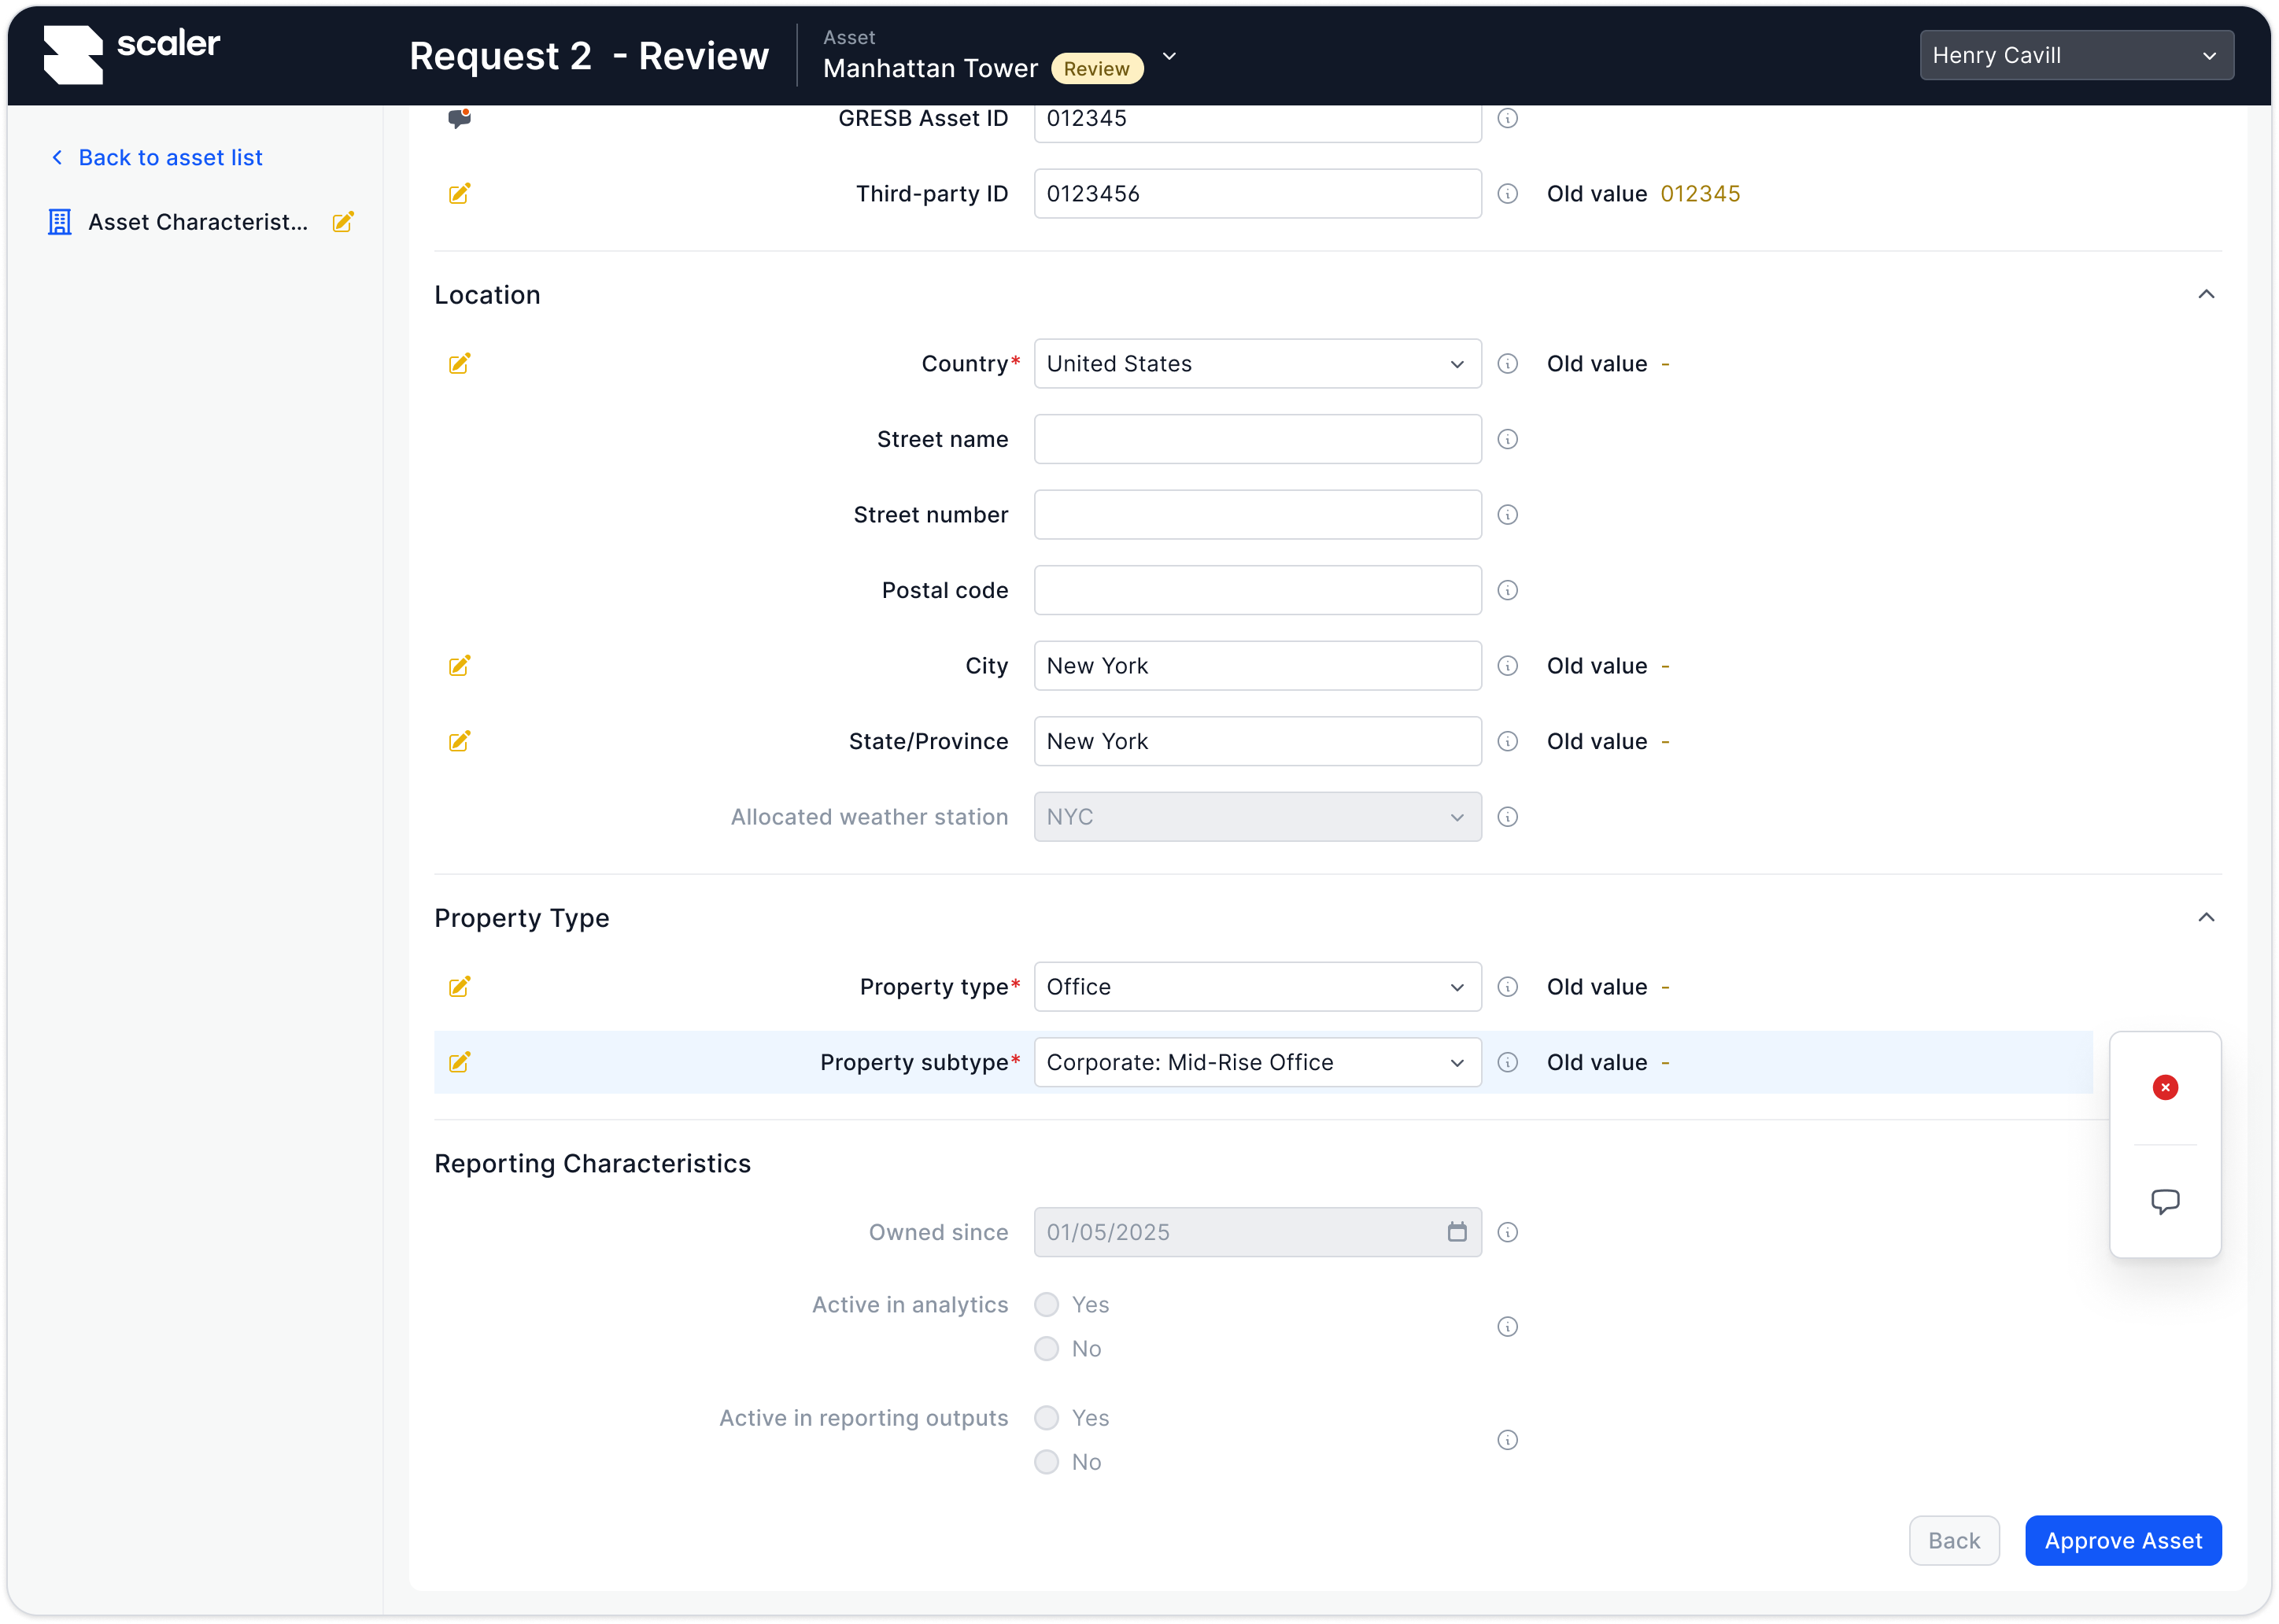
Review & approval
Consultant reviews changes → approves, rejects, or comments → edits become official once approved.
A new permissions model supports this:
Contributor
Can edit data, but all changes must be approved before being included in calculations.
Member
Can edit data directly in Scaler without needing approval.
Admin
Can edit data directly, as well as approve or deny data entered by a data contributor.
Validation & iteration
We tested prototypes with consultants, clients (CBRE, Mitiska, etc) and property managers, validating flows like:
- Creating requests directly from the asset overview.
- Inline editing and contextual help.
- Reviewing pending edits.
- Handling missing or unknown data.
Feedback led to refinements in:
- Edit vs. approved state visibility.
- Ability to mark data as flagged for clarification in addition to leaving comment.
- Clearer asset-level tracking of open requests.
Lessons learned
Integration beats duplication
Moving surveys into the portal eliminated redundancy and reduced reliance on Excel.
Approval is the linchpin
Giving external collaborators editing access was only viable once we added a clear, consultant-controlled approval workflow.
Designing for trust is key
The shift wasn’t just about UX flows, but about ensuring consultants trust the data while empowering property managers to contribute.
Ready to chat about your next project?